
Page 140 - SD RATCH EN
P. 140
140
Sustainability Report 2020
RATCH Group PCL.
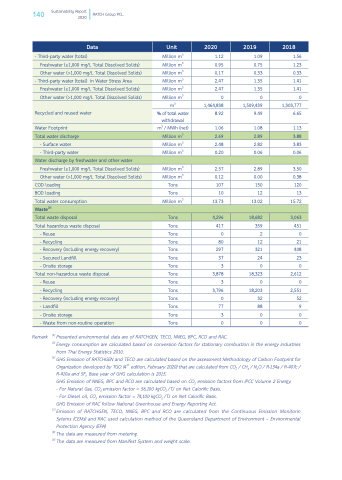
- Third-party water (total)
Data
Unit
Million m3 Million m3 Million m3 Million m3 Million m3 Million m3 m3
% of total water withdrawal m3 / MWh (net)
Million m3 Million m3
Million m3 Million m3 Tons Tons Million m3
1.12 0.95 0.17 2.47 2.47
0 1,464,838 8.92
1.06
2.48 0.20
2.57 0.12 107 10 13.73
1.09 1.56 0.75 1.23 0.33 0.33 1.35 1.41 1.35 1.41
0 0 1,509,439 1,303,777 9.49 6.65
1.08 1.13
2.82 3.83 0.06 0.06
2.89 3.50 0.00 0.38 150 120 12 13 13.02 15.72
359 451 2 0 12 21 321 408 24 23 0 0 18,323 2,612 0 0 18,203 2,551 32 52 88 9 0 0 0 0
2020
2019
2018
Freshwater (≤1,000 mg/L Total Dissolved Solids)
Other water (>1,000 mg/L Total Dissolved Solids)
- Third-party water (total) in Water Stress Area
Freshwater (≤1,000 mg/L Total Dissolved Solids)
Other water (>1,000 mg/L Total Dissolved Solids)
Recycled and reused water
Water Footprint
Million m3
2.69
2.89
3.88
Total water discharge
- Surface water
- Third-party water
Water discharge by freshwater and other water
Freshwater (≤1,000 mg/L Total Dissolved Solids)
Other water (>1,000 mg/L Total Dissolved Solids)
COD loading
BOD loading
Total water consumption
Waste[9]
Total waste disposal
- Reuse
Tons
Tons 417 Tons 0 Tons 80 Tons 297 Tons 37 Tons 3 Tons 3,878 Tons 3 Tons 3,796 Tons 0 Tons 77 Tons 3 Tons 0
4,296
18,682
3,063
Total hazardous waste disposal
- Recycling
- Recovery (including energy recovery)
- Secured Landfill
- Onsite storage
Total non-hazardous waste disposal
- Reuse
- Recycling
- Recovery (including energy recovery)
- Landfill
- Onsite storage
- Waste from non-routine operation
Remark
[4]PresentedenvironmentaldataareofRATCHGEN,TECO,NNEG,BPC,RCOandRAC.
[5] Energy consumption are calculated based on conversion factors for stationary combustion in the energy industries
from Thai Energy Statistics 2010.
[6] GHG Emission of RATCHGEN and TECO are calculated based on the assessment Methodology of Carbon Footprint for
Organization developed by TGO (4th edition, February 2020) that are calculated from CO2 / CH4 / N2O / R-134a / R-407c / R-410a and SF6 Base year of GHG calculation is 2015.
GHG Emission of NNEG, BPC and RCO are calculated based on CO2 emission factors from IPCC Volume 2 Energy.
- For Natural Gas, CO2 emission factor = 56,100 kgCO2 /TJ on Net Calorific Basis.
- For Diesel oil, CO2 emission factor = 74,100 kgCO2 /TJ on Net Calorific Basis.
GHG Emission of RAC follow National Greenhouse and Energy Reporting Act.
[7] Emission of RATCHGEN, TECO, NNEG, BPC and RCO are calculated from the Continuous Emission Monitorin
Sytems (CEMs) and RAC used calculation method of the Queensland Department of Environment – Environmental
Protection Agency (EPA)
[8] The data are measured from metering.
[9] The data are measured from Manifest System and weight scale.
