
Page 59 - SD RATCH EN
P. 59
Economic Performance
RATCH Group PCL.
Sustainability Report 2020
59
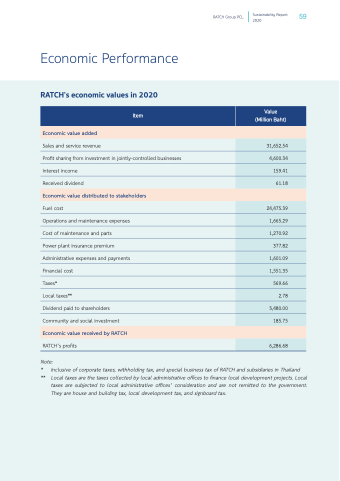
RATCH’s economic values in 2020
Sales and service revenue
Profit sharing from investment in jointly-controlled businesses Interest income
Received dividend
Fuel cost
Operations and maintenance expenses Cost of maintenance and parts
Power plant insurance premium Administrative expenses and payments Financial cost
Taxes*
Local taxes**
Dividend paid to shareholders Community and social investment
RATCH’s profits
Note:
* Inclusive of corporate taxes, withholding tax, and special business tax of RATCH and subsidiaries in Thailand
** Local taxes are the taxes collected by local administrative offices to finance local development projects. Local
taxes are subjected to local administrative offices’ consideration and are not remitted to the government. They are house and building tax, local development tax, and signboard tax.
Economic value added
Economic value distributed to stakeholders
Item
Value (Million Baht)
31,652.54
4,600.34
159.41
61.18
24,475.39
1,665.29
1,270.92
377.82
1,601.09
1,551.35
569.66
2.78
Economic value received by RATCH
3,480.00
185.75
6,286.68
