
Page 85 - SD RATCH EN
P. 85
community in 2020. The operation plan of the power plants will be consulted with the tap water’s producer if concerning of water scarcity arising.
RATCH Group PCL.
Sustainability Report 2020
85
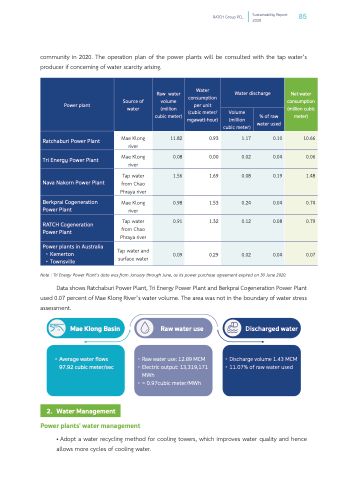
Power plant
Source of water
Raw water volume (million cubic meter)
Water consumption per unit (cubic meter/ mgawatt-hour)
Water discharge
Net water consumption (million cubic meter)
Volume
(million cubic meter)
% of raw water used
Ratchaburi Power Plant
Mae Klong river
11.82
0.93
1.17
0.10
10.66
Tri Energy Power Plant
Mae Klong river
0.08
0.00
0.02
0.04
0.06
Nava Nakorn Power Plant
Tap water from Chao Phraya river
1.56
1.69
0.08
0.19
1.48
Berkprai Cogeneration Power Plant
Mae Klong river
0.98
1.53
0.24
0.04
0.74
RATCH Cogeneration Power Plant
Tap water from Chao Phraya river
0.91
1.32
0.12
0.08
0.79
Power plants in Australia • Kemerton
• Townsville
Tap water and surface water
0.09
0.29
0.02
0.04
0.07
Note : Tri Energy Power Plant’s data was from January through June, as its power purchase agreement expired on 30 June 2020.
Data shows Ratchaburi Power Plant, Tri Energy Power Plant and Berkprai Cogeneration Power Plant used 0.07 percent of Mae Klong River’s water volume. The area was not in the boundary of water stress assessment.
Mae Klong Basin
• Average water flows 97.92 cubic meter/sec
Raw water use
• Raw water use: 12.89 MCM • Electric output: 13,319,171
MWh
• = 0.97cubic meter/MWh
Discharged water
• Discharge volume 1.43 MCM • 11.07% of raw water used
2. Water Management
Power plants’ water management
• Adopt a water recycling method for cooling towers, which improves water quality and hence allows more cycles of cooling water.
